
Census is the complete enumeration of a population or groups at a point in time with respect of well-defined characteristics [OECD]. Census was known to originate during the Roman time in order to identify and track adult males fit for military service. A comprehensive well rounded census helps to define a picture of the populations’ socio-economic condition of certain country or region and helps for effective and efficient policy planning and decision-making process.
In a so called normal circumstance, census data is helpful to governments and service providers in order to allocate their services effectively across the country or targeted population. In most cases the service provided from the knowledge/information gathered through census enhance the development and quality of life of the targeted audience.
Census has the ability to gather all the relevant data such as gender, age, race, education, income, occupation of the target population and helps define the population holistically, however this comes with high financial cost and time in the gathering, evaluation and analysis of the data. The alternative to census is sampling and with this a sample data is collected from a segment of the target population. Sampling is cheaper as compared to census; however it doesn’t give accurate population size and demographic data with regard to sub-population.
Census result is not always taken on face value in many countries and by many organizations around the world. The primary reason for this is that the survey process & procedure, the questionnaire and/or final numbers can be skewed to reflect a predefined goal and this is known as politics of census. The 2006 census of Nigeria, 2007 census of Ethiopia, 2011 census of Canada and 2014 census of Burma are prime examples of this. The politics of census or lack of it is a strong tool in a country were the rule of law either doesn’t exist or easily misinterpreted & abused in support of certain people’s or groups agenda in order to discriminate a group or section of the society. It creates under representation and under privilege of certain demographics in a country and leads to discrimination on access to health care, housing, education and jobs to list a few.
In post independent Eritrea, the country’s first census programme was scheduled for 1998 but due to the war with Ethiopia it was postponed [UNFPA]. In the Eritrea Demographic and Health Survey of 1995 (EDHS 1995) conducted by the Eritrean National Statistics Office, International Economic Cooperation (Office of the President) and Macro International Inc. (Provided technical assistance). Funding was provided by the U.S. Agency for International Development conducted between September and December 1995 with a sample of 5,054 women age 15-49 and 1,114 men age 15-59 in its population section of the report it has stated that “Since there has not been any survey or census conducted in the country before or after independence, the population size is not known with any degree of precision. Some rough professional estimates put the country’s population in the range of 2.5 to 3.5 million. Estimates of the number of Eritreans living abroad range between 700,000 and 1,000,000”
The Eritrean Demographics and Health Survey study was repeated in 2002 (EDHS 2002) which was carried out by the National Statistics and Evaluation Office of Eritrea with financial support provided by USAID & Eritrean Ministry of Health, on the population section of the survey report again it stated that “No population census has ever been carried out in Eritrea. As a result, there are no reliable estimates of the population currently residing in Eritrea or the population of Eritreans living abroad” The EDHS 2002 survey in itself was sample survey covering 9,389 households and 8,754 women age of 15-49 years focusing primarily on women’s & child health care.
Historically, in the 1950’s a sample based population estimate was done in the province of Eritrea mainly in the urban areas with head counts by the ministry of interior for tax and parliamentary representation purpose [Kloos & Adugna]. In the wider Ethiopia in general there were 11 sample based population survey’s in the rural and urban areas between 1950’s and 1981, these were not a comprehensive census covering the whole geographical location but based on estimate, predication and defective data from an earlier sample survey’s.
In 1984, the first comprehensive population study was carried out across Ethiopia covering to the sub-district (Wereda) level. However due to security concern the province of Eritrea was excluded from the survey in addition to a section of Tigray and Harerge provinces. The 1984 Ethiopian census with estimate coverage of 85% of the population came to 42million.
What propelled the author of this article to write on this subject was the perplexity when reading a number of Eritrean cyber articles & debates written by cyber warriors wereby certain individuals or groups use Eritrean demographic statistic data without validating it to support and enforce their argument and debate on their right to dominate the Eritrean socio-economic, cultural and political sphere without making sure that their number stands scrutiny were actual census data is lacking in the first place.
In most cases people state the demographic numbers they find in CIA fact book or Wikipedia as the base of their argument, but relying solely on this approach will weaken their argument because estimated numbers doesn’t stand the test of time. CIA World Fact book in its Frequently Asked Questions (FAQ) segment states that its numbers are based on estimates and projections when no census data is available for a country. However to have a stronger estimate and projection result, data have to start with a solid actuals such as comprehensive census or all inclusive population head count.
The author challenged himself to understand the Eritrean demographic conundrum with the data that is accessible. While working on this article I searched to find a complete Eritrean demographic data with its detailed information on the internet, unfortunately such information was hard to come by. I came across historic and current Eritrean population estimate data from two sources. Both these sources are based on information obtained from Eritrean Ministry of Local Government document
- Awate.com [Explore Eritrea: The Land, The People, Published April 28, 2005]
- Calvin College [National Atlas for developing countries]
Almost all available Eritrean demographics and population data is based on estimates and projection, I decided to do the same with the available 1952 data obtained from awate.com as the foundation of my analysis. One of my reasons for doing so was that the 1952 data not only has head-count information it also has religious affiliation as shown below in Table 1, which was absent in the 1997 & 2001 population estimate data provided by Eritrean Ministry of Local Government.
|
Native Language |
Overall Population |
Religious Affiliation # By Region |
|||
|
# |
% |
Muslim |
Christian |
Animists |
|
| Tigrenga |
524,000 |
51% |
37,000 |
487,000 |
0 |
| Tigre |
329,000 |
32% |
322,000 |
7,000 |
0 |
| Saho |
66,000 |
6% |
64,000 |
2,000 |
0 |
| Barya* & Kunama |
41,000 |
4% |
31,000 |
3,000 |
7,000 |
| Blen |
38,000 |
4% |
27,000 |
11,000 |
0 |
| Denakil |
33,000 |
3% |
33,000 |
0 |
0 |
|
1,031,000 |
100% |
514,000 |
510,000 |
7,000 |
|
Table 1: Eritrean demographics based on 1952 population data
Based on Table 1, we can deduce that the percentile on religion affiliation by region as shown below on Table 2.
|
Native Language |
Religious Affiliation % By Region |
||
|
Muslim |
Christian |
Animist |
|
| Tigrenga |
7.07% |
92.93% |
0.00% |
| Tigre |
97.87% |
2.13% |
0.00% |
| Saho |
96.87% |
3.13% |
0.00% |
| Nara* & Kunama |
75.60% |
7.31% |
17.07% |
| Blen |
71.05% |
28.95% |
0.00% |
| Denakil |
100.00% |
0.00% |
0.00% |
Table 2: Eritrean demographics religious affiliation by region based on 1952 population data
*In this analysis based on the 1952 demographics description, the term Nara will be used instead of BARYA for the NARA ethnic group.
The next step is to create estimates on religious affiliation data by region for the 1997 and 2001 data with the following assumption.
Assumption
- The proportion of religious affiliation by region ratio remained similar between 1952 and 2001. This assumption will stand until other contradictory data is available.
- The new administration zone between the highland and lowland area on average will have similar population number in spite of the boundary change
- Eritreans in diaspora will not be considered in this estimate as the author doesn’t want to include additional variables.
Table 3 and Table 4 below shows the estimate Eritrean population demographics affiliation by region based on the assumption stated above.
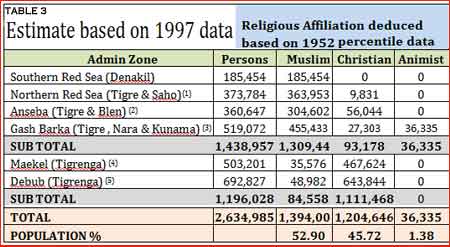
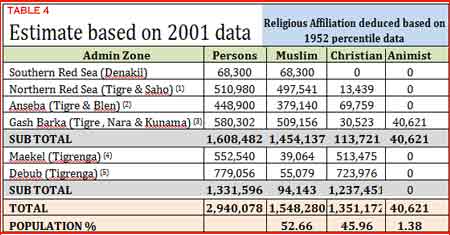
(1) Estimate based on 1952 data average religious affiliation for Tigre & Saho (97.37% Muslim, 2.63% Christian)
(2) Estimate based on 1952 data average religious affiliation for Tigre & Blen (84.46% Muslim, 15.54% Christian)
(3) Estimate based on 1952 data average religious affiliation for Tigre, Barya & Kunama (87.74% Muslim, 7% Animist, 5.26% Christian)
(4) & (5) Estimate based on 1952 data average religious affiliation for Tigrigna (92.93% Christian, 7.07% Muslim)
To make thing a little bit interesting, let us skew the second assumption on the demographics of the new administration zone and postulate on what if the new boundaries not only takes land away from the former highland provinces (Akele Guzay, Hamasien & Seraye) but also a portion of its population. This could affect the religious affiliation by region and its proportion based on the 1952 data. Just as a disclaimer, the author has no knowledge or data on the impact of the boundary changes on the demographics of the former Eritrean provinces, this exercise is theoretical in order to squish the thirst for knowledge in the absence of solid data.
To test the above scenario using the 2001 data, the population data is skewed by 5% for the Northern Read Sea, Anseba and Gash Barka administration zone be from former highland provinces and all be from the Christian demographics segment in order to offset the impact of boundary change. (This is based on hypothetical theory with hypothetical percentage as the author does not have any actual data for this analysis).
As shown in table 5 below, when the numbers are skewed to reflect new boundary
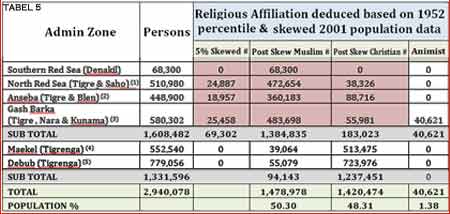
The summary of the analysis of the 1997, 2001 and 2001skewed numbers by geography and religious affiliation below shows the population difference between the two geographical locations.
| Demographics by Geography |
1952 |
1997 |
2001 |
| Highland (Tigrenga & Saho) | 590,000 | 1,196,028 | 1,331,596 |
| Lowland (Denakil, Tigre, Blen, Nara, Kunama) | 441,000 | 1,438,957 | 1,608,482 |
| Demographics by Religion |
1952 |
1997 |
2001 |
2001 Skewed |
| Muslim |
514,000 |
1,394,001 |
1,548,280 |
1,340,404 |
| Christian |
510,000 |
1,204,646 |
1,351,172 |
1,559,048 |
| Animist |
7,000 |
36,335 |
40,621 |
40,621 |
For many reasons the Eritrean demographics number is a hotly debated and challenged topic, the author encourages the readers to analyze and critic this document and its outlined figures in order to advance the understanding of current Eritrean demography.
The author believes that just because a demographic figures are found somewhere in the internet (be it Wikipedia or CIA fact book or other), it should not be taken on face value but be reviewed and analysed instead of being regurgitated unless otherwise it is proven to come from a comprehensive unbiased census data.
Finally, from this exercise the author also believes that all Eritrean ethnic groups are majority in their own land and region; therefore they should not be seen or be treated as minorities just to make others feel comfortable.
Senifalu@yahoo.com
References
- 1952 & 1997 Eritrean Population Count (Data from The Ministry of Local Government document via Awate.com) http://web.archive.org/web/20060630203303/https://awate.com/explore/explore.htm
- 2001 Eritrean Population Count (Data from The Ministry of Local Government document via Calvin College ) – http://gis.calvin.edu/atlas/countries/eritrea/People/pop.pdf
- 2001 Eritrean Household Count (Data from The Ministry of Local Government document via Calvin College ) – http://gis.calvin.edu/atlas/countries/eritrea/People/numberHH.pdf
- 2002 Eritrea Demographic and Health Survey
- OECD : Organization for economic cooperation and development
- United Nation Population Fund
- United Nations, Demographic Yearbook, 1989
- The Ethiopian population: Growth and Distribution By Helmut Kloos and Aynalem Adugna
- CIA World Fact Book
Comments